
Appearance
Debugging
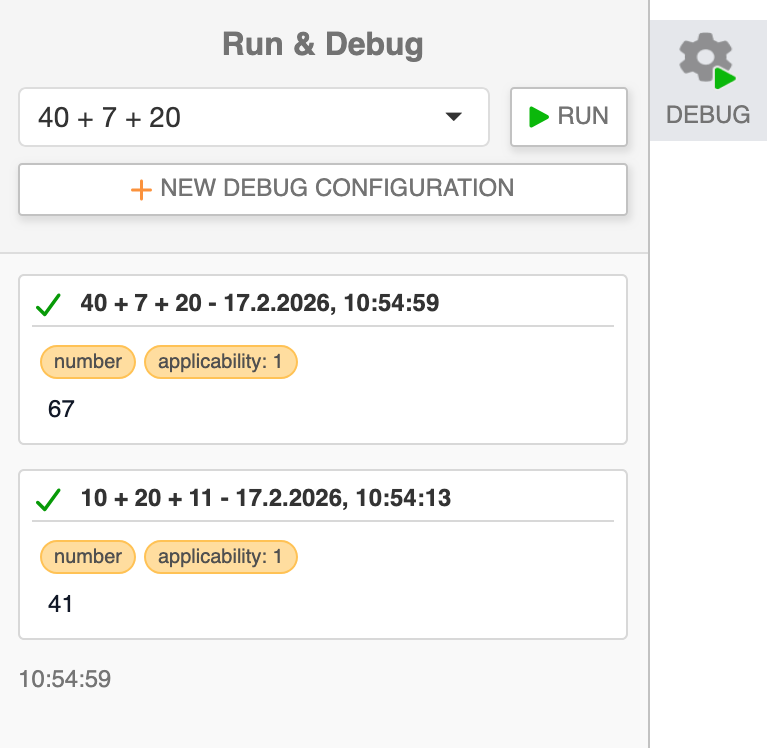
With the  debugging panel, MLMs can be run with no arguments or arguments defined in a debug configuration. The results are displayed in a result list, with the most recent execution on top.
Running an MLM
Select either Run without arguments or a debug configuration in the dropdown, and click  . The result will appear in the list below.
Alternatively, use the dropdown in the quick actions and the  button for the same result.
Debug configurations
A debug configuration defines a set of inputs for an MLM under a name, for easier debugging of common execution scenarios. To create a new debug configuration, hit  in the side panel. To edit or delete a configuration, use the
  buttons next to it in the dropdown.
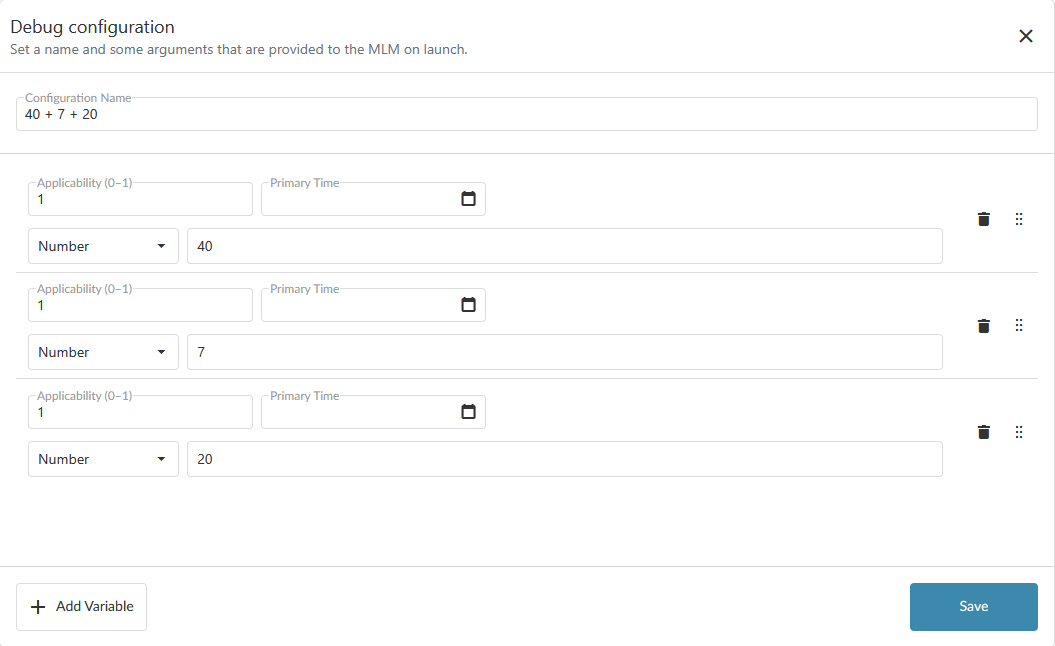
The configuration name is required, so is at least one argument.
Each argument can be configured with an applicability (default 1) and a primary time (default null) according to Arden Syntax specification. The dropdown contains most possible types in Arden Syntax (to be expanded). Only after selecting a type, enter a value to its right.
A new argument can be added to the end of the argument list with  . Arguments can be moved by grabbing and dragging the
  grab handle and deleted by clicking
  .
.
Result list
Results of MLM executions are listed in the result list, with the most recent result first.
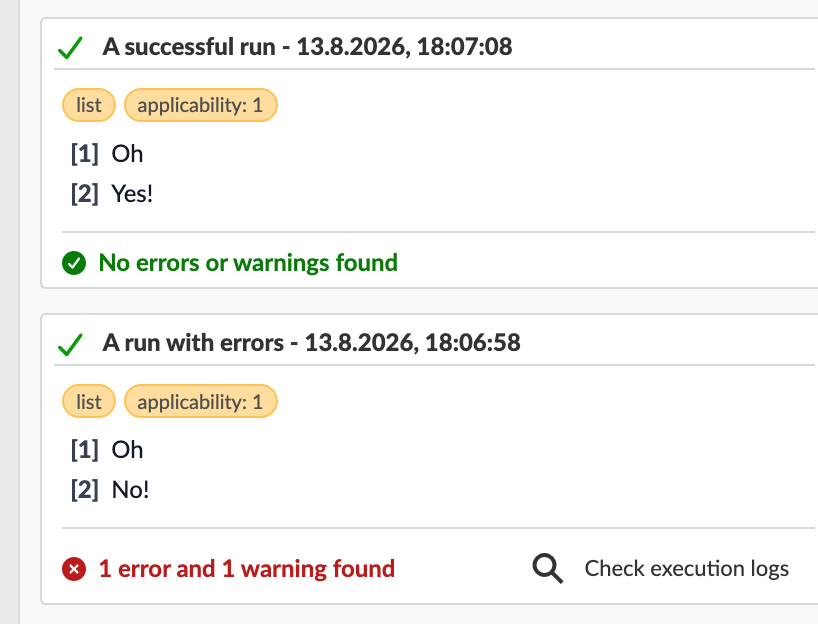
The header of each card shows the name of the debug configuration and the date & time of execution.
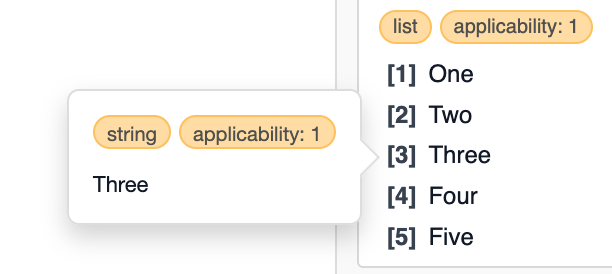
The content of the card is a list of each result returned by the MLM. Lists and nested objects can be expanded, and details about a variable within an object or list can be viewed by hovering over it.
The lower part of the card displays whether any errors or warnings occurred during the run. If any error or warning is present, the execution logs popup can be opened by clicking  .
.
Execution logs
The execution logs popup displays the traces of an MLM run. Traces are a hierarchical call stack with the launched MLM at the root. Any calls to extensions and other MLMs will be logged under that root trace, with their own calls being handled similarly. The most notable causes of errors and warnings are extensions and interpreter warnings, such as invalid use of Arden Syntax operators with a null result.
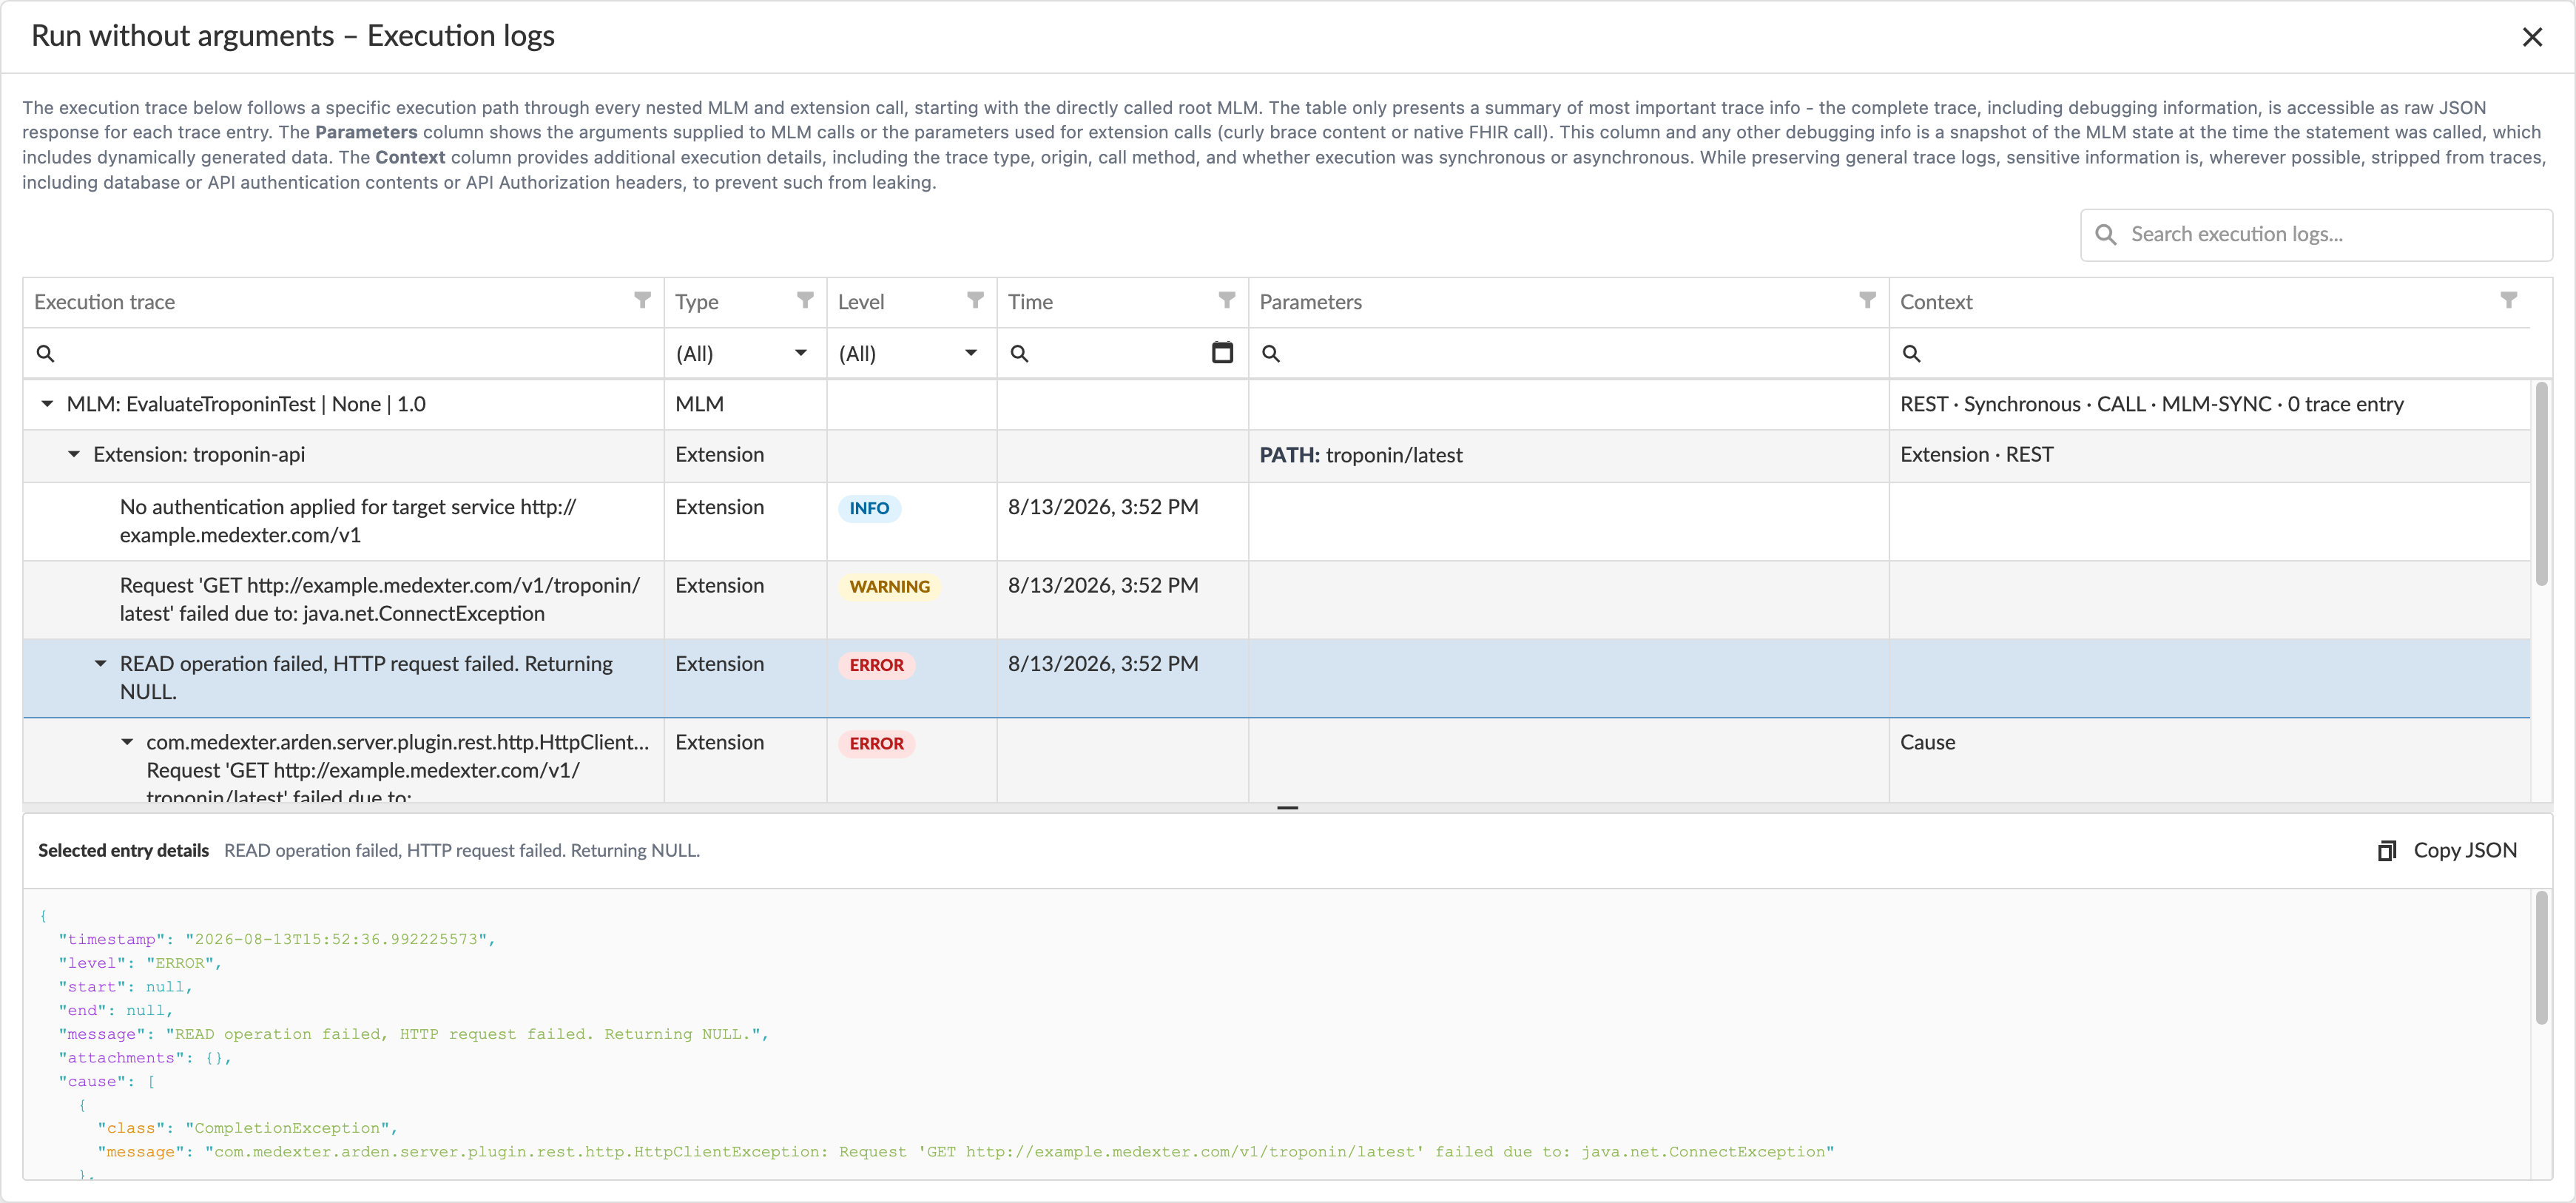
The table can be filtered by properties through its header. It presents a summary of the most important information for each trace. For reviewing in detail, the raw JSON of the selected trace is displayed in the bottom panel.
Sensitive information
Sensitive information like API keys and Authorization headers is stripped from traces.
Traces can be incomplete
Tracing is a new feature to the ArdenSuite and not every extension or invalid use of an Arden Syntax operator outputs traces. Compatibility will be extended with every release. If you encounter a scenario where traces cannot pinpoint the cause of your error, mail us at ardensuite@medexter.com and it will be considered for the next update.